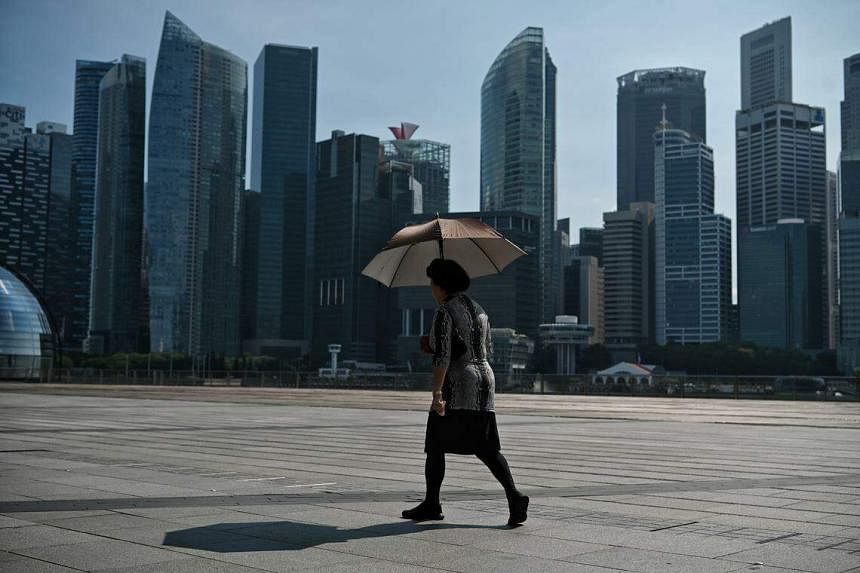

It is one of the hottest topics in the Republic. Every year, the mercury rises and experts point to climate change as the main culprit.
The hotter days and warmer nights are made worse by all those air-conditioners working overtime and heat-trapping buildings popping up. Things are being done, such as more trees being planted, but that is cold comfort when everyone is feeling the heat.
So just how much hotter is Singapore getting? To get to the bottom of things, The Straits Times dug deep into decades of temperature data to observe the trends over time. The interactive project was published on Tuesday.
Our conclusion is that changes in monthly and yearly average temperatures, as well as the number of warmer nights, all show it is getting hotter in Singapore.
This is backed by the findings of the Centre for Climate Research Singapore, which has projected an increase in daily mean temperature of 1.4 deg C to 4.6 deg C towards the end of this century, depending on how quickly, and deeply, greenhouse gas emissions are cut.
But this is only part of the story.
The team behind ST’s data project wanted to better understand exactly how hot-and-bothered folk in Singapore are being affected by warmer weather, and what can be done about it.
First, a look at how the project came about.
“The unusually cold and wet weather across the start of the year made me wonder about the trends in Singapore’s temperatures. Is this an anomaly? If so, why do such fluctuations occur? Isn’t Singapore supposed to be affected by the effects of climate change?” said data visualisation journalist Ang Yi Zhe.
“We thought if we could dive into the data, we could make sense of these day-to-day, and perhaps month-to-month, changes, as well as more longer-term trends.”
The team decided the best approach was an analysis of the history of daily temperatures in Singapore. They opted for data from the Changi climate station, which has the longest running record that is publicly available – from 1983 to 2022.
Mr Ang used public data from the Meteorological Service Singapore, and referenced climate reports to analyse temperatures across more than 14,600 days to see how anomalous they were in the past 40 years.
Next was to think of how to visualise data or trends over time – comparing temperatures for a specific day or night with past years, or temperature trends compared with previous years and months. The average reader may not know how to interpret absolute temperature values – what 30 deg C even means or feels like, said Mr Ang.
To figure out how anomalous the temperature was, he calculated its deviation from the climatological norm, and mapped it to different colours: red for higher than normal, blue for lower than normal. This is a common scientific method used by climatologists.
Other ways to make the temperature data relatable included choosing time periods that feel more recent to readers and comparing them with long-term trends. For example, the interactive opens with a comparison between the forecast for the day they are reading it, which is updated via real-time weather data, and past temperature trends.
“We wanted to connect the data with our readers in a personal and light-hearted way. Sleep is important for all of us, so we reframed the narrative to focus on sweatier nights, based on the increasing trend of exceptionally warm nights that we uncovered by looking at minimum temperatures,” said data visualisation editor Rebecca Pazos.
According to the data, the number of exceptionally warm nights – where the temperature exceeded more than 2 deg C above average or was within the highest 10 per cent – has been increasing over the past 40 years. “In particular, in 2019, we had to endure a total of 112 warm nights, the highest in the past 40 years and making up almost a third of the year,” said Mr Ang.
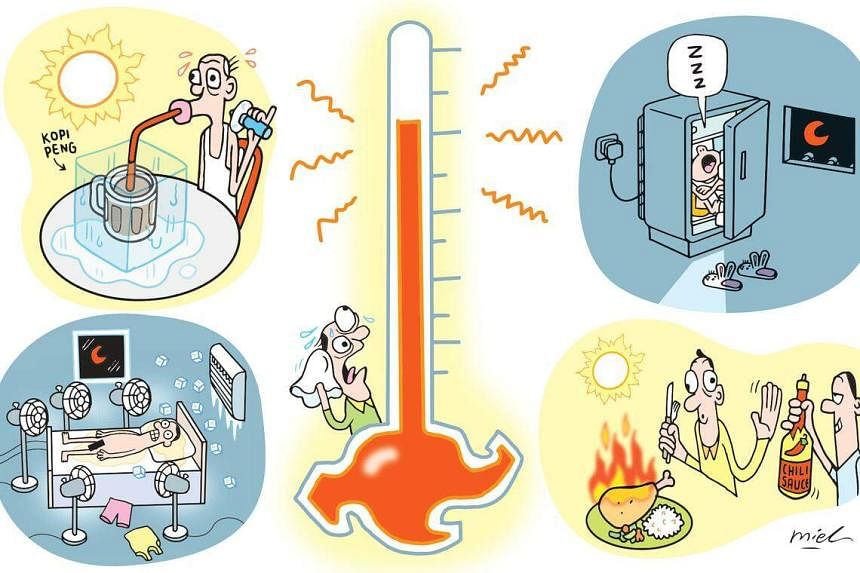
And for those sleepless in Singapore, turning up the air-conditioning to cool things down only adds more heat to those steamy nights, as air-conditioners are a major source of urban heat. They also contribute to greenhouse gas emissions because of the power generation needed to work them.
Mr Ang also looked at seasonal trends between months and years. For instance, El Nino years tend to be hotter and La Nina years cooler. Looking ahead, El Nino could be making a return later in 2023.
“If we were to zoom out to look at yearly averages, there is clearly an increasing trend, albeit slightly obfuscated by weather phenomena like El Nino and La Nina. Tonight may feel colder than normal, but the long-term warming trend still persists,” he said.
And the main takeaway?
“At least for me, looking at the data from different angles drove home the fact that my lifestyle was bound to be affected by this inevitable change in climate,” said Mr Ang.
Ultimately, how much Singapore sizzles in the future depends on what steps everyone takes.
There is plenty that can be done. This includes buying the most efficient air-conditioners, better insulation of the home, and taking steps to reduce our carbon footprint in daily activities, such as choosing to walk or cycle, or buying locally sourced foods.